| Software Tool | Performance Metrics, Objective/s | ||
| Calliope | Objectives: Total Cost, Emissions | ||
| Capital Cost | Cost of fuel | Capacity Factor per technology | |
| O&M Cost | Demand Not Met | Foot print | |
| Levelized cost per technology | Fuel consumption | ||
| DER-CAM | Objectives: Total Annualized Cost, Emissions | ||
| Capital Cost | Fuel consumption | Energy purchased and sold to the grid | |
| O&M Cost | Capacity Shortage curtailment | Capacity Factor per technology | |
| CoE | Total Energy produced | Renewable fraction | |
| Cost of fuel | Total Energy consumed | Foot print | |
| Demand Not Met | Payback | ||
| HOMER | Objective: Net Present Cost | ||
| Capital Cost | Simple Payback | Energy purchased and sold to the grid | |
| O&M Cost | Discounted Payback | Capacity Factor per technology | |
| CoE | Demand Not Met | Renewable fraction | |
| Cost of fuel | Fuel consumption | MRP (Maximum Renewable Penetration) in a year | |
| Present Worth | Capacity Shortage curtailment | Foot print | |
| Annual Worth | Total Energy produced | Emissions | |
| ROI | Total Energy consumed | ||
| IRR | Excess of electricity | ||
| Weight | |||
| iHOGA | Objectives: Net Present Cost, Unmet Load Emissions, Human Development Index (HDI) | ||
| Jobs Created | |||
| Capital Cost | Simple Payback | Energy purchased and sold to the grid | |
| O&M Cost | Discounted Payback | Capacity Factor per technology | |
| CoE | Debt Payments | Renewable fraction | |
| Levelized cost of energy | Demand Not Met | MRP (Maximum Renewable Penetration) in a year | |
| Cost of fuel | Fuel consumption | Foot print | |
| Present Worth | Total Energy produced | Weight | |
| Annual Worth | Total Energy consumed | ||
| ROI | Excess of electricity | ||
| IRR | |||
| REM | Objectives: Annualized Cost, Social Cost of Unserved Energy | ||
| Capital Cost | Management Cost | Emissions | |
| O&M Cost |
Some of the software tools are open-source where the source code is available to the public. However, open-source also means a higher learning curve compared to the other tools. For example, building the model in Calliope is text-based and the user has to be familiar with the syntax and the keywords. Some tools do not have publicly available source code but the software is free to use as in the case of DER-CAM. But this can also mean that the support and functionality may be limited. HOMER and iHOGA have free and commercial versions.
| Software Tool | Built-in Sensitivity Analysis | API | Availability |
| Calliope | Scenario analysis | Programmable | Open-source |
| DER-CAM | none | In beta mode | Free |
| HOMER | Sensitivity Analysis | only for control strategies | Commercial with free trial |
| iHOGA | Sensitivity Analysis | none | Commercial with free education version |
| REM | Sensitivity Analysis | – | for collaboration, for commercialization |
Cuesta, M. A., T. Castillo-Calzadilla, and C. E. Borges. "A critical analysis on hybrid renewable energy modeling tools: An emerging opportunity to include social indicators to optimise systems in small communities." Renewable and Sustainable Energy Reviews 122 (2020): 109691.
[1] Ciller, Pedro, et al. "Optimal electrification planning incorporating on-and off-grid technologies: the Reference Electrification Model (REM)." Proceedings of the IEEE 107.9 (2019): 1872-1905.
[1] https://calliope.readthedocs.io/en/stable/user/introduction.html]]>
| Software Tool | Geographical coverage | Electrical Network Considerations |
| Calliope | Local, Regional or National | Net transfer capacity between regions |
| DER-CAM | Local, Regional | Import/Export, Power flow, Identify best node in network to install DER |
| HOMER | Local | Import/Export |
| iHOGA | Local | Import/Export |
| REM | Local, Regional or National | Net transfer capacity, one location in the microgrid |
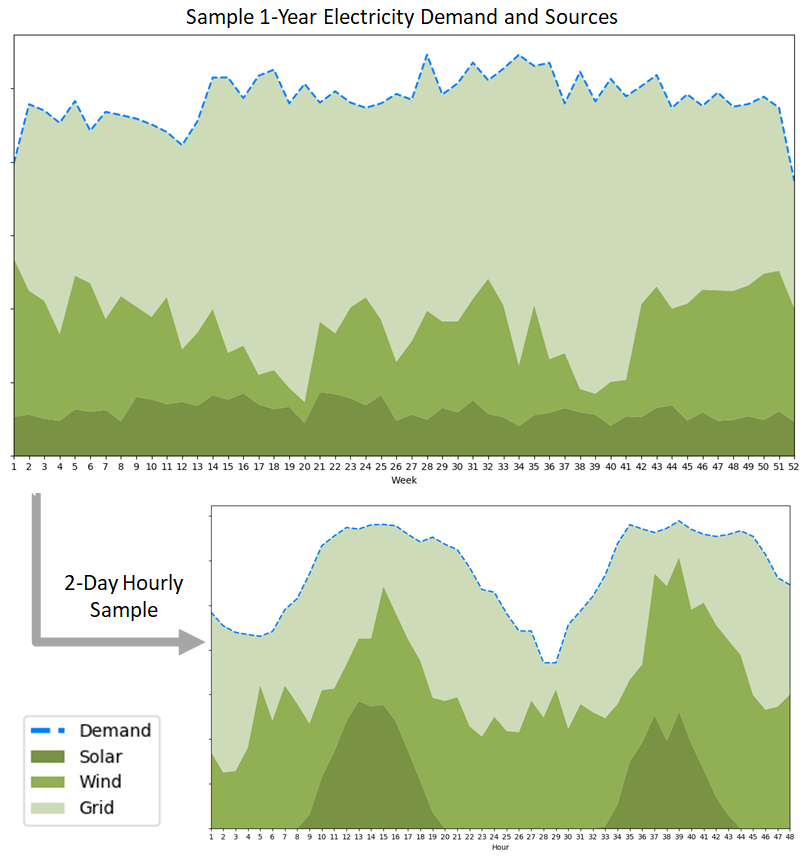
Example REM outputs are shown below:
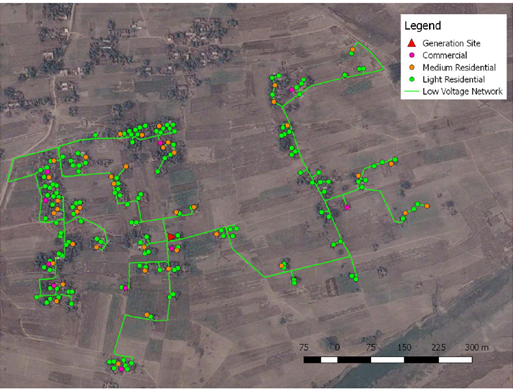
Source: Ciller, Pedro, and Sara Lumbreras. “Electricity for all: The contribution of large-scale planning tools to the energy-access problem.” Renewable and Sustainable Energy Reviews 120 (2020): 109624.
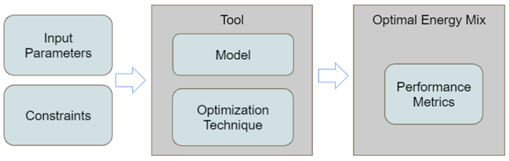
These tools can be characterized according to the optimization technique, energy mix portfolio, grid consideration, geographic coverage, output variable/s to optimize, output performance metrics, model complexity, availability and necessary software, and options to handle risk or different scenarios.
The table below lists different software tools and the optimization algorithm they employ. Calliope and Distributed Energy Resource-Customer Adoption Model (DER-CAM) employ mixed integer linear programming that is solved using either open or commercial solvers. Open and free solvers include CBC and GPLK while commercial solvers are Gurobi and CPLEX. Hybrid Optimization of Multiple Energy Resources (HOMER) uses a proprietary derivative-free algorithm to arrive at the optimal energy mix. HOMER is generally classified as a simulation-based model instead of the strictly mathematical programming optimization technique[1] . Moreover, as the name suggests, improved Hybrid Optimization by Genetic Algorithm (iHOGA) applies Genetic Algorithm in sizing energy resources. The Reference Electrification Model (REM) applies a Pattern search-based method with a master-slave decomposition where discrete variables such as generator size are at the master level and continuous variables such as solar and battery sizes are at the slave level.
| Software Tool | Optimization technique |
| Calliope | Mixed Integer Linear Programming – Open and commercial solvers |
| DER-CAM | Mixed Integer Linear Programming – Open and commercial solvers |
| HOMER | Simulation, proprietary derivative-free |
| iHOGA | Genetic algorithm |
| REM | Pattern search – based |
[1] Cardoso, Gonçalo, et al. "The impact of ancillary services in optimal DER investment decisions." Energy 130 (2017): 99-112.]]>
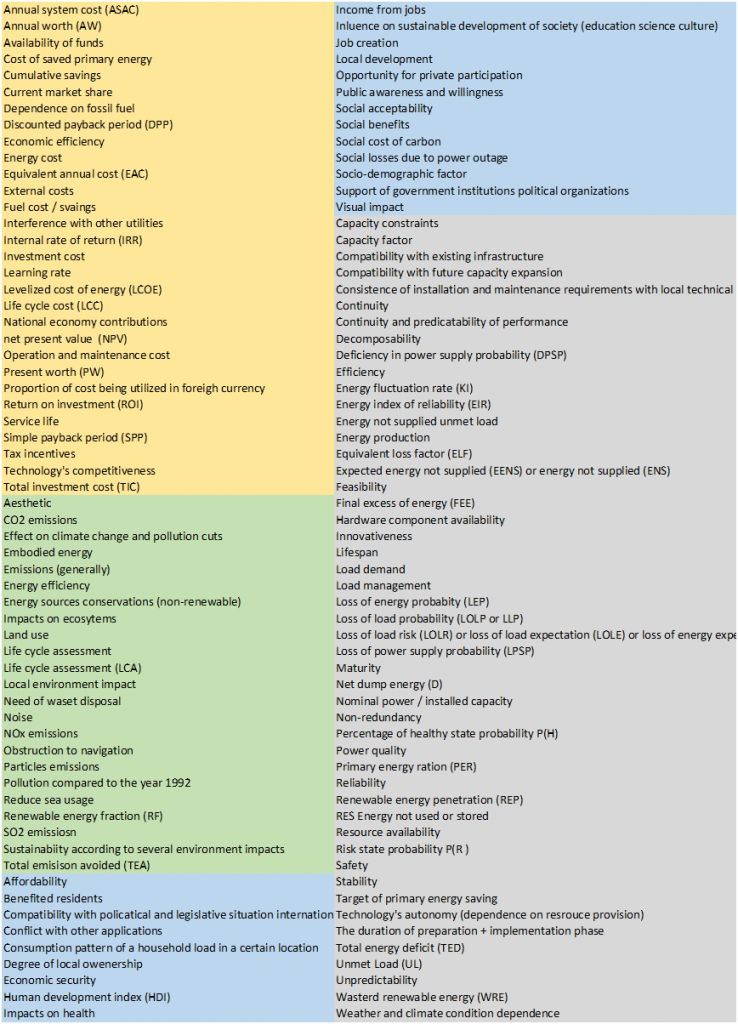
The figure below shows the different performance metrics in literature that are categorized into different aspects of sustainability. Most of these performance indicators fall into the technical and economic aspects. Economic indicators pertain to cost or revenue of the energy system. Technical aspects are typically about how reliable the energy system is in satisfying the electricity demand. However, to ensure sustainability, environmental and social performance metrics of planned energy systems are also being considered. Environmental indicators are the impact of the energy system to the climate and ecology. Social aspects are related to affordability, local community development and the acceptance of the stakeholders which are all important for energy access projects.

Cuesta, M. A., T. Castillo-Calzadilla, and C. E. Borges. "A critical analysis on hybrid renewable energy modeling tools: An emerging opportunity to include social indicators to optimise systems in small communities." Renewable and Sustainable Energy Reviews 122 (2020): 109691..
Babatunde, Olubayo Moses, Josiah Lange Munda, and Yskandar Hamam. "A comprehensive state-of-the-art survey on hybrid renewable energy system operations and planning." IEEE Access 8 (2020): 75313-75346.]]>
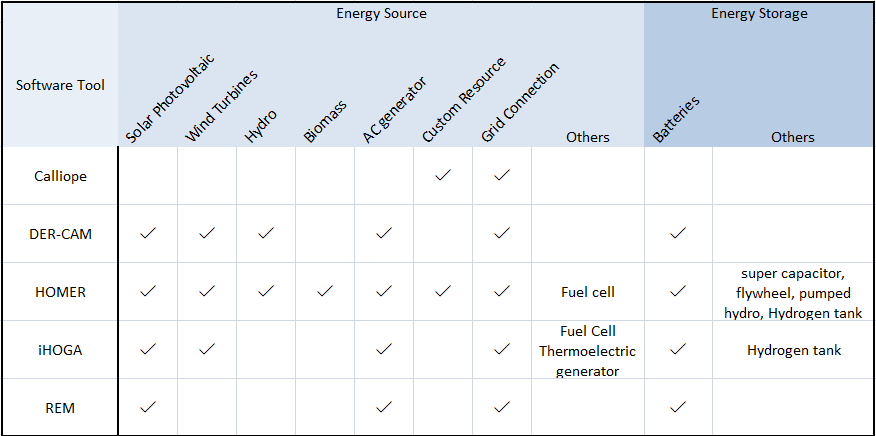
To provide a solution of energy mix, multiple sources of energy should be available as alternatives. With the cost competitiveness of renewable energy technologies, these systems are typically hybrid renewable energy systems that can be coupled with energy from conventional generators and the grid. An example of the portfolio of energy technologies available in a tool is shown below:
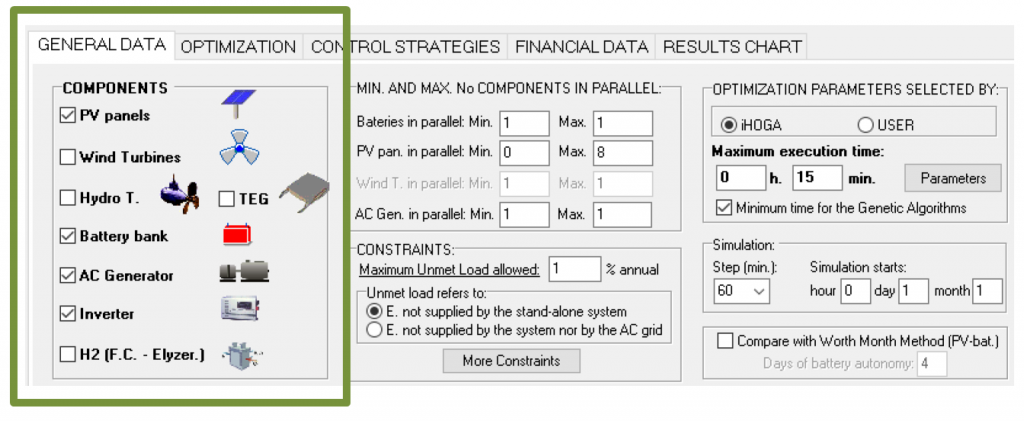
Source: Dufo-López, R., and J. Bernal-Agustín. “iHOGA User Manual.” Faculty of Engineering, University of saragossa, spain (2020).
The tool should be able to identify the optimal combination of energy technologies. This is in contrast to simulation of only one or several scenarios of energy mix. The primary purpose of simulation is to predict generated energy and to assess system performance. The tool should be capable of either systematically simulating multiple scenarios and/or apply traditional optimization techniques with the goal of finding the best-case sizes of energy technologies.
]]>