Using these prevalent concepts, frameworks which put prime on sustainability are prioritized and will be utilized to serve as guides for organizing systems into regulated structures that developers can use to build programs such as those for expanding access to household electricity. Frameworks such as the UN Global Compact for Sustainable Energy, Sustainable Energy Access Planning, Derisking Renewable Energy Investment, Regulatory Indicators for Sustainable Energy and the Multi-Tier Framework are fundamental to the scope of this report.
UN Global Compact for Sustainable Energy Framework
The United Nations (UN) with its partners developed the UN Global Compact for Sustainable Energy framework which identifies and shapes the role of businesses in achieving sustainability targets centered on energy development by 2030. The 2012 UN General Assembly outlined these targets in the “Sustainability For All (SE4ALL)” initiative, and they are universal access to modern energy services, improving energy efficiency and increasing the utilization of renewable resources.
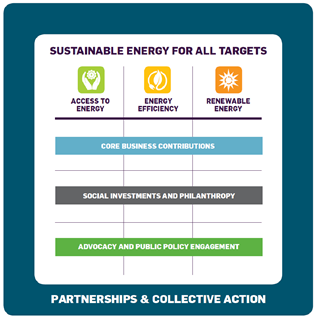
Source: UN Global Compact
Sustainable Energy Access Planning Framework
Developed by the Asian Development Bank (ADB) through their Energy for All Initiative which seeks to maximize access to energy by providing an improved framework and assessment basis to shape responses and build better solutions, the sustainable energy access planning (SEAP) framework has features that are distinct from traditional electricity and energy planning frameworks. The identification of cost-effective and sustainable resource and technology options for providing universal access to basic energy services as well as the assessment of the affordability of cleaner-energy service options to energy-poor households are among its main objectives.
This framework focuses on social inclusiveness and takes into account the ability of even the poorest households in gaining access to electricity and other cleaner forms of energy to meet their basic energy needs for lighting, cooking and heating. It also considers the acceptable minimum level of basic energy services to the energy poor and uses tools to assess the energy demand of non-poor households.
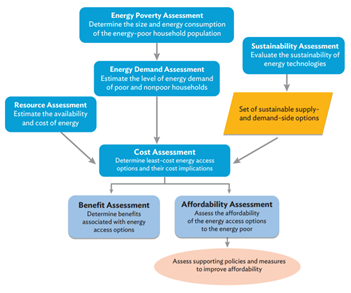
Source: ADB, Sustainable Energy Access Planning: A Framework
Derisking Renewable Energy Investment Framework
The Derisking Renewable Energy Investment (DREI) framework aims to assist policymakers in developing countries to cost-effectively promote investment in renewable energy by utilizing publicly-available methodologies, financial tools, models and resources.
The DREI framework was launched in 2013 by the United Nations Development Programme (UNDP) and was originally focused on utility-scale renewable energy. Recently it has taken on an energy access expansive nature by extending to on-grid rooftop PV, off-grid solar home systems and off-grid solar mini-grids. The overall aim of the framework is to cost-effectively achieve a risk-return profile that encourages private sector investment.[2]
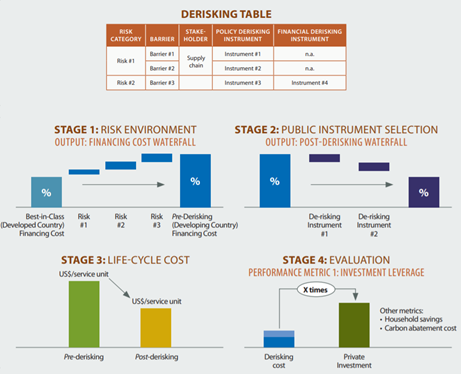
Source: UNDP, Derisking Renewable Energy
[1] G20 2016 China, Enhancing Energy Access in Asia and the Pacific: Key Challenges and G20 Voluntary Collaboration Action Plan, http://www.g20.utoronto.ca/2016/enhancing-energy-access-in-asia-and-pacific.pdf.
[2] UNDP, Derisking Renewable Energy Investment: Off-Grid Electrification, 27.
]]>
This section starts with a discussion on development frameworks that are applicable to the Philippines. Strategies that boost sustainability, reduce cost and are patterned for renewable energy systems are given emphasis. The conventional and renewable resources with their feasibility of their operation are discussed. Software tools are then presented that can help to identify the optimal size and combination of these energy technologies for decentralized generation. Afterwards, given the similarity of energy resources and demographics, an overview of the energy situation in the Southeast Asia region is discussed with a brief examination of the best practices and implementation methods that can be redesigned for local use.
]]>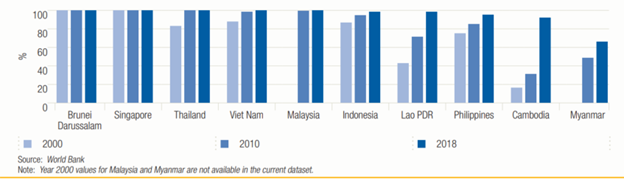
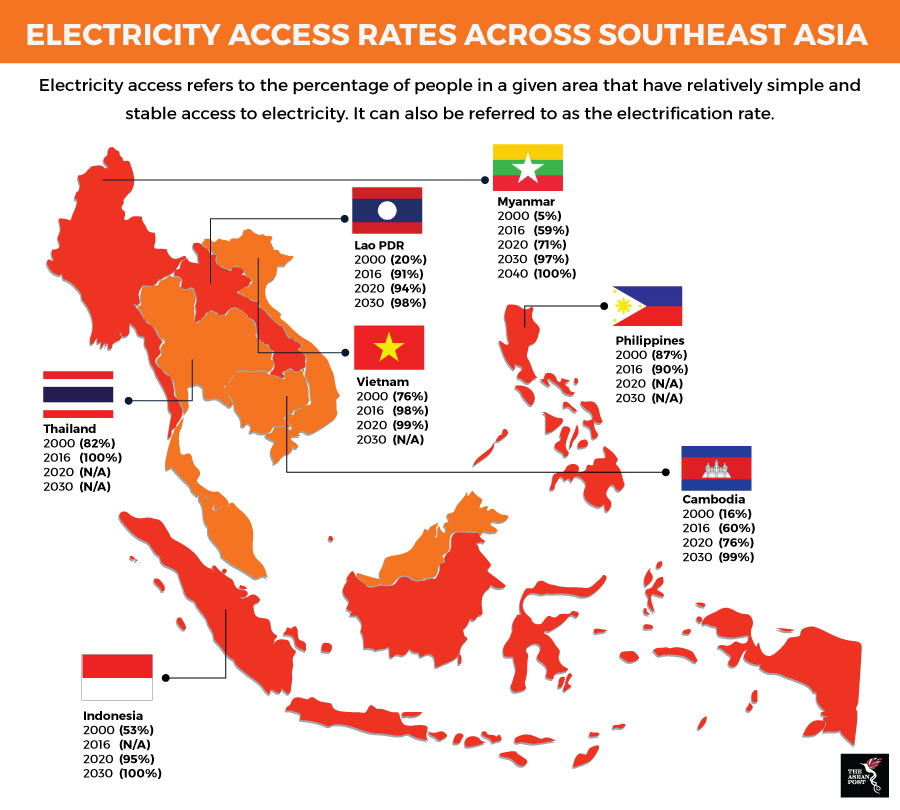
Percentage of population with access to electricity in ASEAN.[1]
The next diagram illustrates the difference between rural and urban electrification across AMS.
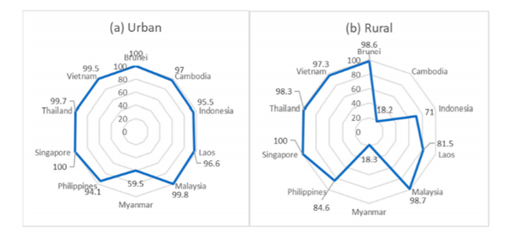
Percentage of electrification in urban and rural areas in Southeast Asia in 2016. [2]
The final diagram shows the quality of energy access as a function of frequency and duration across AMS states.
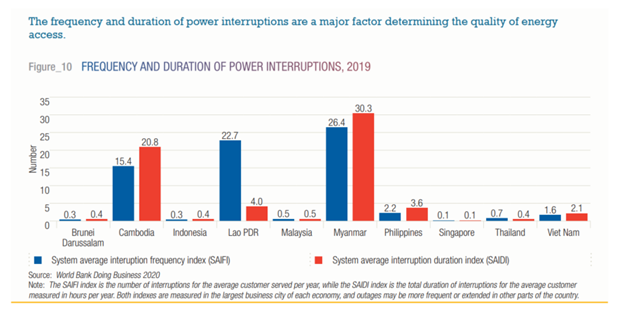
Frequency and Duration of Power Interruptions 2019
[1] ASEAN Center for Energy, China Renewable Energy Engineering Institute; Practical Experience and Prospects for Electricity Accessibility in ASEAN
[2] Carvioto, et al. The Effects of Rural Electrification on Quality of Life: A Southeast Asian Perspective https://www.mdpi.com/1996-1073/13/10/2410]]>
If the basis of underserved areas is on the duration of electricity access and frequency of interruption, then the reliability reports from DUs must be considered. For this report, some of the underserved data was extracted from the report of the SIIG and NPC-SPUG plants.
In 2019, 77 of the 279 (28%) SIIG had 24 hour operation[1]. The remaining 72% operated between 5 to 16 hours per day. “The total installed capacity in the 279 SIIGs decreased from 568 MW in 2018 to 526 MW in 2019. The 7.4% decrease can be attributed to the decommissioning of aging generating units as well as the reduction of rental capacities of the NPC-SPUG.”
| SERVICE HOURS | 2018 | 2019 |
|---|---|---|
| 5 | 135 | 134 |
| 8 | 49 | 48 |
| 12-16 | 29 | 20 |
| 24 | 64 | 77 |
| Total SIIG | 277 | 279 |
Based on the Missionary Electrification Development Plan 2016-2020, the number of potential households in off-grid areas was 1,543,516. This represents 6.72% of the total household potential in the Philippines based on the 2015 PSA census. The 2015 served HH in off-grid area was 761,746 (49.35% of off-grid HH). It is unknown how many of these households were experiencing less than 24 hours of electricity access.
| AREA | BARANGAYS | HOUSEHOLDS | SERVED | ENERGIZATION |
|---|---|---|---|---|
| Luzon | 2,550 | 1,000,048 | 602,641 | 60.26% |
| Visayas | 410 | 123,212 | 84,218 | 68.35% |
| Mindanao | 596 | 420,256 | 74,887 | 17.82% |
| Total | 3,556 | 1,543,516 | 761,746 | 49.35% |
HH Electrification Level in Off-Grid Areas as of December 2015
**based on reported potential households in the DPPs of Ecs
[1] DOE, “2019 Power Situation Report” https://www.doe.gov.ph/electric-power/2019-power-situation-report
]]>% HH Electrification = (potential HH – unserved HH)/potential HH
| 2015 | 2016 | 2017 | 2018 | 2019 | |
|---|---|---|---|---|---|
| Total Potential HH | 22,310,082 | 22,721,430 | 22,984,971 | 22,984,971 | 22,984,971 |
| Served HH | 19,994,430 | 20,597,320 | 20,936,499 | 22,093,782 | 23,229,866 |
| Unserved HH | 2,315,652 | 2,124,110 | 2,048,472 | 891,189 | 1,618,264 |
| HH Electrification Level (%) | 86.92 | 90.65 | 91.09 | 96.12 | 92.96 |
Household Electrification 2018-2019
| Region | Potential HH | Served HH | Served/ Potential | Served HH | Unserved HH | Served/ Potential | %HH with new formula |
| LUZON | 13,318,261 | 13,833,515 | 103.87% | 14,489,298 | 295,378 | 108.79% | 97.78% |
| NCR | 3,095,766 | 3,331,503 | 107.61% | 3,417,347 | 0 | 110.39% | 100.00% |
| CAR | 395,881 | 378,550 | 95.62% | 389,522 | 26,446 | 98.39% | 93.32% |
| I | 1,151,629 | 1,176,984 | 102.20% | 1,225,613 | 15,117 | 106.42% | 98.69% |
| II | 804,380 | 787,599 | 97.91% | 822,480 | 35,910 | 102.25% | 95.54% |
| III | 2,566,558 | 2,800,745 | 109.12% | 2,923,947 | 14,650 | 113.92% | 99.43% |
| IV-A | 3,404,958 | 3,760,214 | 110.43% | 3,900,956 | 33,626 | 114.57% | 99.01% |
| IV-B | 682,668 | 595,766 | 87.27% | 676,104 | 66,557 | 99.04% | 90.25% |
| V | 1,216,421 | 1,002,154 | 82.39% | 1,133,329 | 103,072 | 93.17% | 91.53% |
| VISAYAS | 4,401,698 | 4,142,520 | 94.11% | 4,368,043 | 269,280 | 99.24% | 93.88% |
| VI | 1,716,637 | 1,579,496 | 92.01% | 1,636,255 | 155,923 | 95.32% | 90.92% |
| VII | 1,699,148 | 1,683,983 | 99.11% | 1753748 | 54287 | 103.21% | 96.81% |
| VIII | 985,913 | 879,041 | 89.16% | 978,040 | 59,070 | 99.20% | 94.01% |
| MINDANAO | 5,265,012 | 4,117,747 | 78.21% | 4,372,525 | 1,053,606 | 83.05% | 79.99% |
| IX | 799,219 | 550,730 | 68.91% | 578,282 | 220,937 | 72.36% | 72.36% |
| X | 1,042,929 | 963,290 | 92.36% | 1,006,024 | 78,189 | 96.46% | 92.50% |
| XI | 1,177,461 | 985,374 | 83.69% | 1,012,858 | 164,603 | 86.02% | 86.02% |
| XII | 1,050,680 | 739,965 | 70.43% | 859,060 | 191,620 | 81.76% | 81.76% |
| CARAGA | 574,338 | 662,330 | 115.32% | 692,624 | 0 | 120.60% | 100.00% |
| ARMM | 620,385 | 216,058 | 34.83% | 223,677 | 398,257 | 36.05% | 35.80% |
| Grand Total | 22,984,971 | 22,093,782 | 96.12% | 23,229,866 | 1,618,264 | 101.07% | 92.96% |
Data Sources
| DATE | ELECTRIFICATION | SOURCE | ACCESSED |
|---|---|---|---|
| Dec 2019 | 92.96 | https://www.foi.gov.ph/requests/aglzfmVmb2ktcGhyHQsSB0NvbnRlbnQiEERPRS03NjU5MzI3MzgzODAM | Nov, 19, 2020 |
| June 2019 | 91.25 | DOE excel spreadsheet (need to be confirmed) | |
| Dec 2018 | 96.12 | https://www.foi.gov.ph/requests/aglzfmVmb2ktcGhyHQsSB0NvbnRlbnQiEERPRS03NjU5MzI3MzgzODAM | Nov. 19, 2020 |
| Dec 2018 | 95.27 | PEP 2018-2040 | |
| Dec 2017 | 91.09 | PEP 2018-2040 | |
| July 2016 | 89.6 | PEP 2016-203 | |
| Aug 2012 | 99.98 | PEP 2012-2030 |
With the DDP, DUs are reporting on their status and plans for their franchise area. These include information on the current household electrification situation and the information on all electrification activities planned to be undertaken whether sitio electrification, household electrification, turn-over to another DU, or a declaration to waive. DPP also contains information on the DUs reliability indices or distribution-side interruptions.
]]>Characterizing Served, Unserved, and Underserved
Energy access used to be defined as whether a household has access to electricity or not[1]. If for as long as one light bulb is electrified in a home, it already counts as an electrified household. In the Philippines, this is defined as “served” area. In contrast, those without access to electricity are called “unserved”. For those without continuous 24-hour access, they are classified as “underserved”.
Officially, in the DOE circular No. DC2019-11-0015, unserved area refers to an area with no electricity access, distribution system lines, individual home system or connection to any microgrid system. Underserved area refers to an area where electricity services are less than twenty-four (24) hours daily which is currently served by individual home system, microgrid system or distribution facilities because of non-implementation of applied capital expense projects, non-compliance with the service parameters of the Philippine Distribution Code, or any other reason, resulting to an overall failing mark based on the latest annual technical evaluation of performance of distribution system in relation to ERC’s imposed targets.[2]
- [1] UN GTF
- [2] DOE, Department Circular No. DC2019-11-0015 https://www.doe.gov.ph/sites/default/files/pdf/issuances/dc2019-11-0015_0.PDF
Deprecated: ltrim(): Passing null to parameter #1 ($string) of type string is deprecated in /home/u189388336/domains/solarsolutions.ph/public_html/portal/wp-includes/wp-db.php on line 3030

Deprecated: ltrim(): Passing null to parameter #1 ($string) of type string is deprecated in /home/u189388336/domains/solarsolutions.ph/public_html/portal/wp-includes/wp-db.php on line 3030